Petrobras S.A. is selling 98 onshore and offshore oil and gas fields in Brazil, between 2016 and 2017.
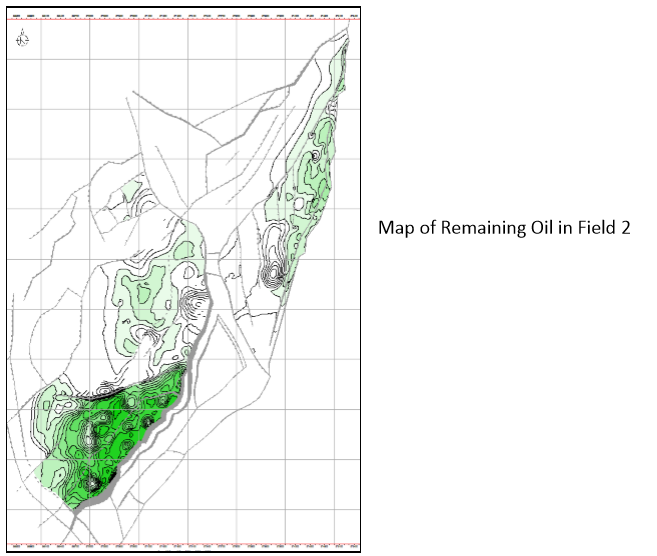
July 4, 2019It is possible to generate good maps of remaining oil and injected water via 3D geological modelling.
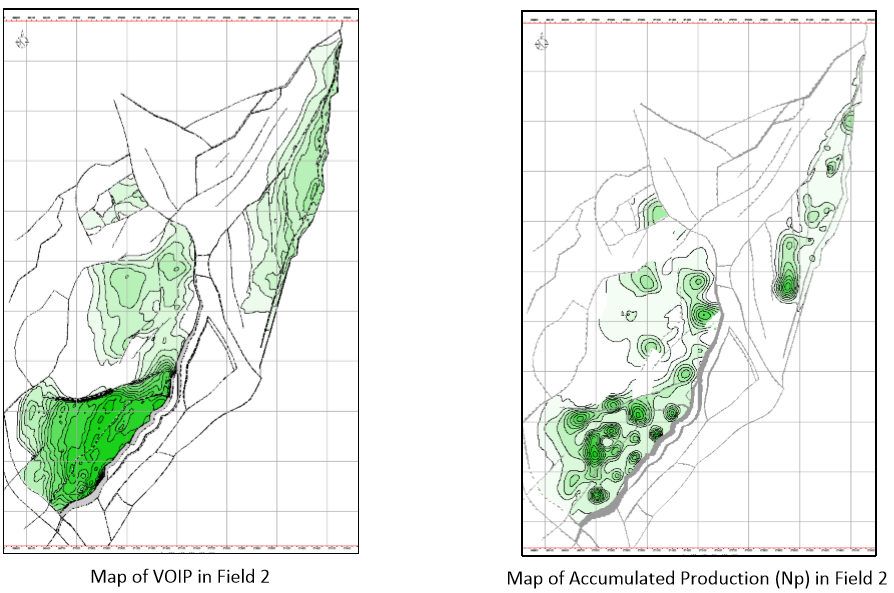
These maps can show the pockets of oil which accumulate between closed production wells.
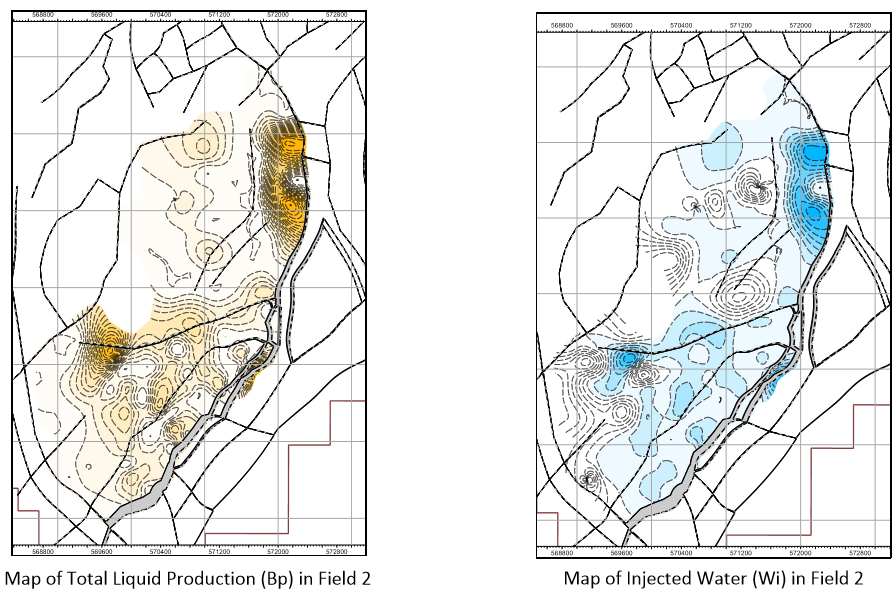
The pressure differential caused by the production and injection wells, along with the more permeable zones, control the drainage of the majority of the reservoir, creating flow zones.
In this way, pockets of oil tend to form in the less permeable zones and/or between the wells which were “prematurely” closed.
Re-opening these wells is a cheap way of producing a volume of oil additional to that calculated for the reserve. Locating them, among hundreds of wells in a mature field, becomes a valuable challenge.
Maps of remaining oil and injected water increase the chances of making the right choice in reopening these wells and also serve to orientate new infill locations.
Reservoir Geologists and, in particular, Reservoir Engineers, know that these results can be reached through a Flow Simulation. However, not the cost of the procedure herewith proposed.
The maps of remaining oil and injected water can be generated directly via 3D geological modelling, reproducing all of the geological and petrophysical heterogeneities modelled.
All the time spent on Flow Simulations is economised, and the cost of Simulation Software is avoided.
Clearly it deals with a procedure much less elaborate than a Flow Simulation, but probably no less accurate, as, on incorporating fewer variables, it becomes less sensitive to the inaccuracies of those same variables.
The fact is that the procedure presented here was tested in the re-opening of 11 wells, located in two different mature fields.
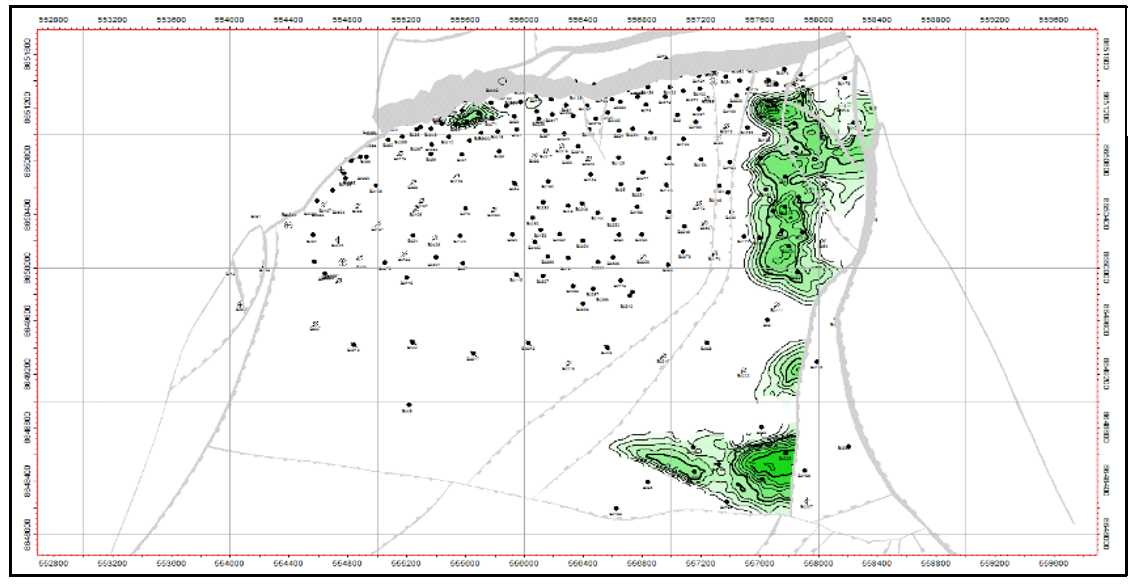
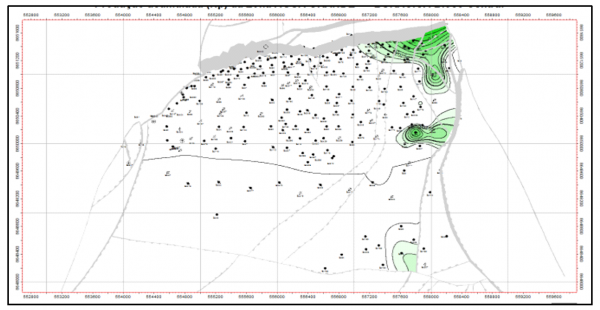
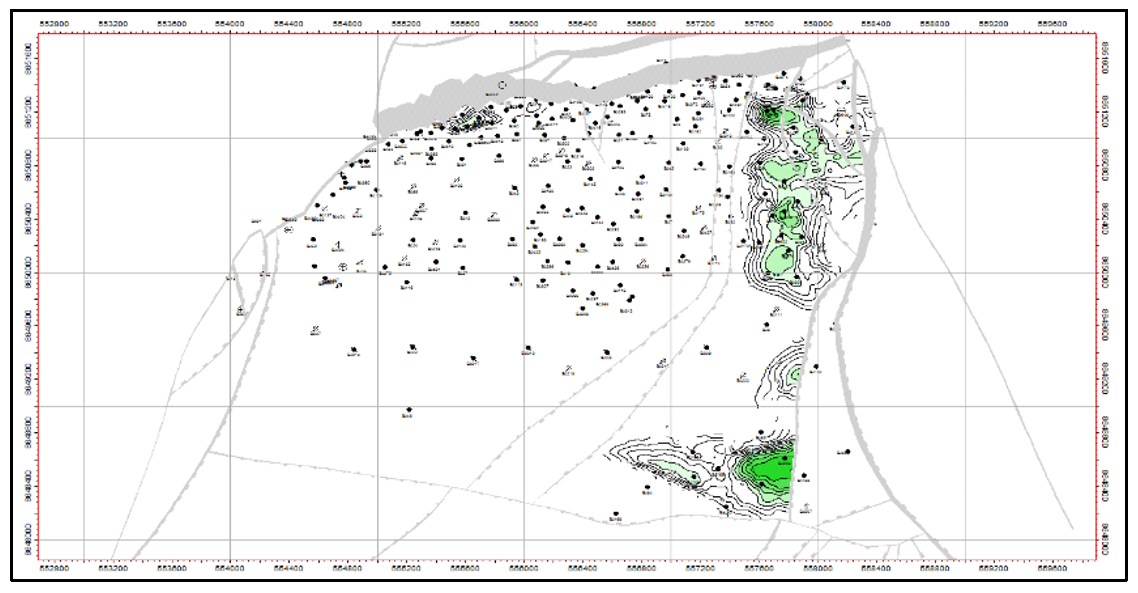
Both the fields represent almost 60 years of production of approximately 500 drilled wells each, and show almost 90% Recovery Factor. In both, intense injection of water, and some gas, took place (figures 1, 2, and 3).
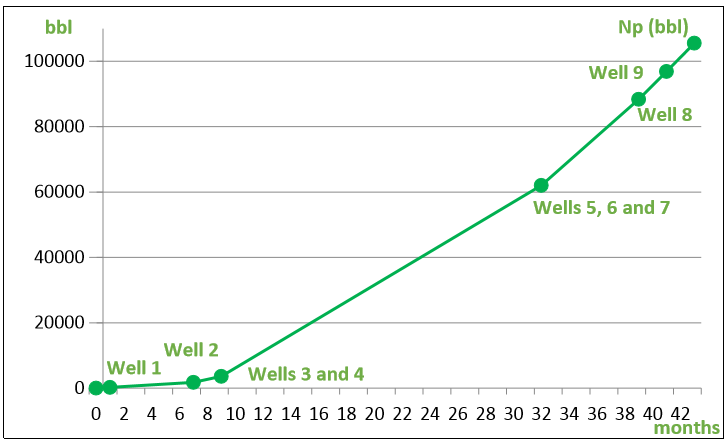
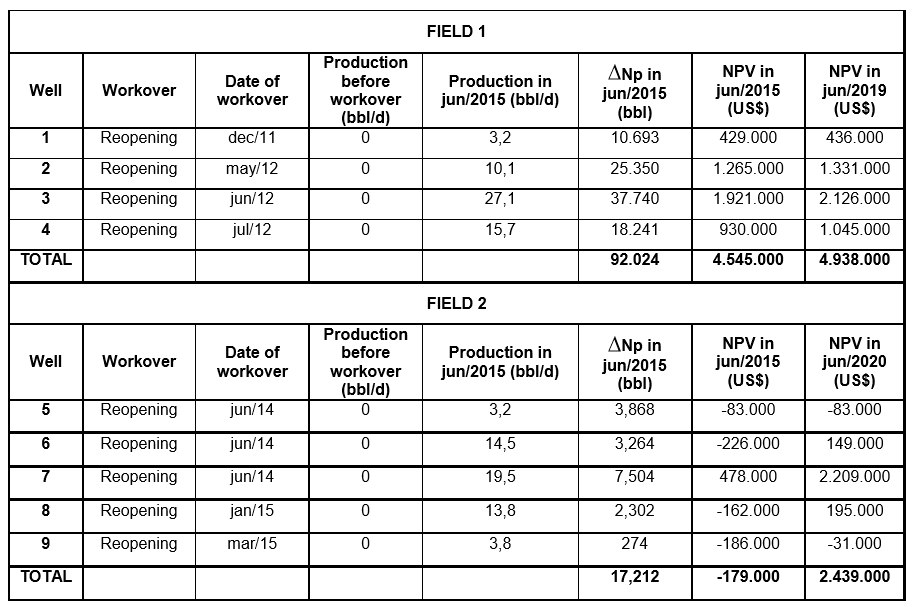
Of the eleven wells re-opened, nine began to produce oil again, and in a period of 42 months, accumulated a production of 109.236 bbl (figure 4).
The four wells re-opened in Field 1 projected a positive NPV of US$ 4.938.000 in four years of production, whilst the five wells re-opened in Field 2 projected a positive NPV of US$ 2.439.000 in five years of production (table 1).
As well as this, the maps generated for Field 2 were also used for an infill location, which, on 10/31/2016, presented an accumulated production of 43.715 bbl in 13 months, with a current flow of 100 bbl/d (barrels/day).
This geological modeling process is provided by General Geology Consultants Ltd, which is a new company founded by seniors geologists and geophysicists who have been working at Petrobras S.A. for decades.
Figure 1 – Maps in Field 1.
Figure 2 – Field Maps 2
Figure 3 – Maps of Gross Production and Injected Water of Field 2
Figure 4 – Accumulated production of oil (Np) since the re-opening of nine wells in two mature fields
Table 1 – Physical and economic results of the re-opening of nine wells, in Fields 1 and 2, based on the maps of remaining oil and injected water
